
UX Project: Ordering Food via Movie Theater App
- Arend Pryor
- Oct 30, 2023
- 3 min read


Author: Arend Pryor | Created: 07/2023
Details: Google UX Design Certificate - Portfolio Project - Ordering Food via Movie Theater App
Project Background:
We are adding functionality to our existing movie theater app that will allow users to skip the lines and order food and drinks ahead of time
The project should help to identify and eliminate pain points, increase usability, and result and a positive experience for moviegoers
Included below are artifacts created during this project:
User Personas:
Overview: As a result of research performed for this project, two personas were created to represent fictional users whose goals and characteristics represent the needs of our moviegoers and their goals.
User Journey Map:
Overview: The user journey map included below was created in order to identify a series of experiences our fictional user encountered when ordering food and drinks at a movie theater
Competitor Audit Research:
Overview: The competitive audit below includes a summary and ratings for many of the strengths and weaknesses identified when comparing the mobile food ordering process for our competitors. The goal here was to find out what our competitors were doing well and how we can improve upon this and potentially do it better
Click here to view the results of this audit via Google Sheets document or open the pdf below (note, the Google sheets version will provide a better viewing experience)
Competitive Audit Report:
Overview: This report summarizes the research from the above document. It includes details for the following areas:
A list of our key competitors
The type and quality of their products
Details on how they position themselves in the market
Strengths and weaknesses
Gaps and opportunities
User Flow:
Overview: The following user flow shows the path taken by a typical user on our competitor's movie theater app or website as part of ordering food/drinks. This will provide us with a general overview of areas to include, or address, in our designs

Storyboards:
Overview: Both Big Picture and Close-Up storyboards were created as a way of creating visual representations of the user's journey and the problems being faced
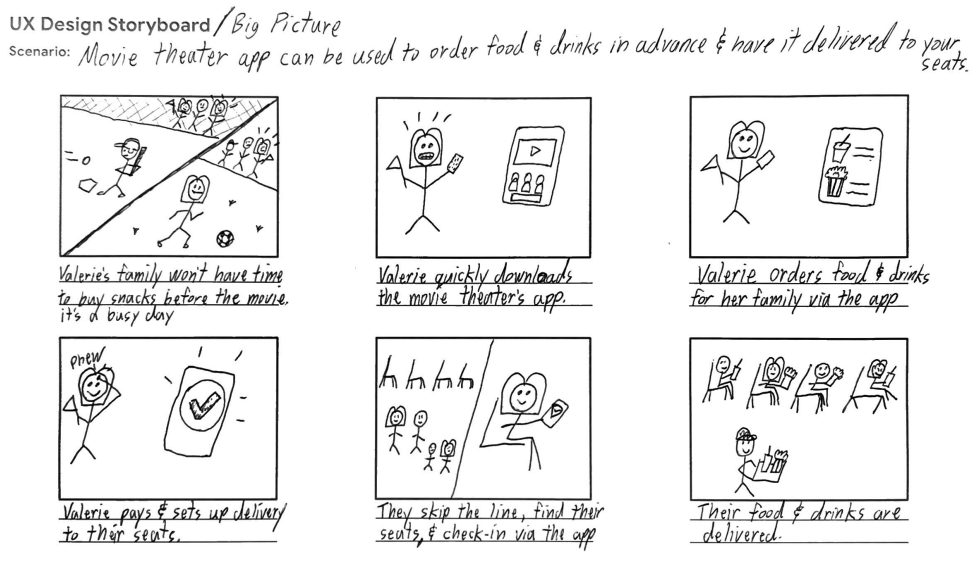
Big Picture Storyboard:
Overview: This helps us understand the entire user experience, including the different challenges, potential pain points, and types of interactions the user will encounter
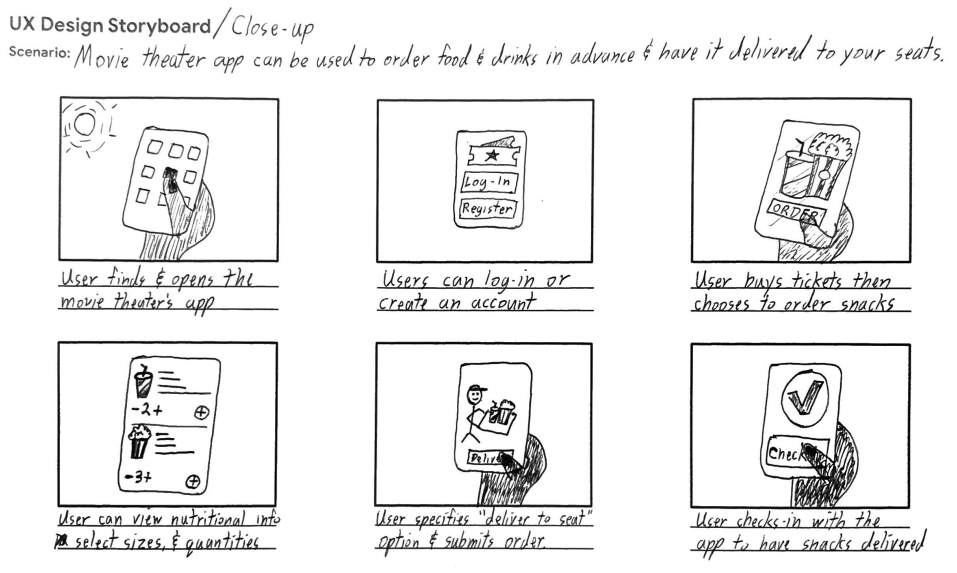
Close-Up Storyboard:
Overview: The sketches here focus on the product itself and things such as what happens on the screens, how the user transitions from one screen to the next, and the functions included that alleviate their pain points
Digital Wireframes:
Overview: The document below includes screenshots of paper wireframes that were then converted to digital versions. As a result of using an iterative approach to the design process, digital wireframes were created when a paper version did not exist.
Wireframes are also available to view in Figma (Click here)
UX Research Study - Planning:
Overview: The document below includes the details for a UX Research study that was planned and executed as part of this project
Research Goals: Determine if users are able to complete the core tasks associated with ordering food and drinks ahead of time via the app. Identify roadblocks that might prevent users from taking advantage of this process. Determine if the movie theater app is difficult to use
UX Research Study - Notes Collected:
Overview: The following document includes notes that were taken while participants were led through the UX study
Click here to view the notes collected via Google Sheets document or open the pdf below (note, the Google sheets version will provide a better viewing experience)
Affinity Diagram/Mapping Exercise:
Overview: Using the affinity mapping technique, feedback received during the UX Research study above was added to digital sticky notes in order to categorized the feedback
Click here to view the notes collected via Google Jamboard or open the pdf below (note, the Google version may provide a better viewing experience)
Identifying Patterns, Themes and Insights:
Overview: Using info from the affinity mapping exercise, patterns and themes were discovered, which then led to making informed insights. The document below includes the details for each
Presentation - UX Research Study Results:
Overview: This presentation provides a summary of the results for the UX Usability study that was performed as part of this project and also includes recommendations for moving forward
Click here to view the presentation via Google Slides or open the pdf below (note, the Google version includes speaker notes as well)
Presentation - UX Research Insights/Updates:
Overview: This presentation provides a recap of the feedback received during the UX research study and shows the specific changes made to the wireframes in an effort to address the areas of concern
Click here to view the presentation via Google Slides or open the pdf below (note, the Google version includes speaker notes as well)
High Fidelity Mockups:
Overview: Using the wireframes and insights from the presentation above, high fidelity mockups were created to help further bring the designs to life.
Mockups are available to view in Figma (Click here) or via screenshots in the pdf below


Comments